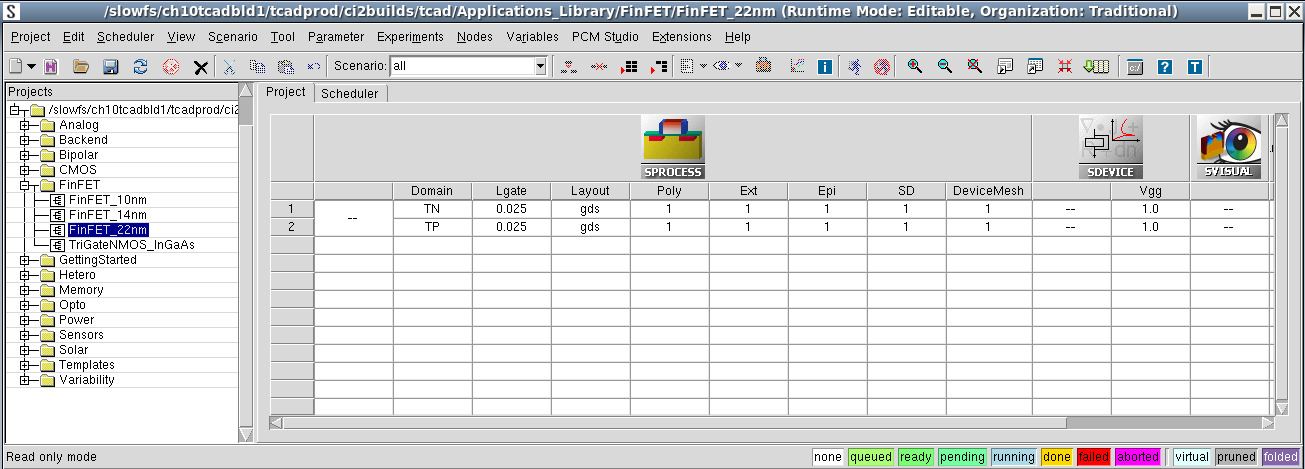
Sentaurus Visual:
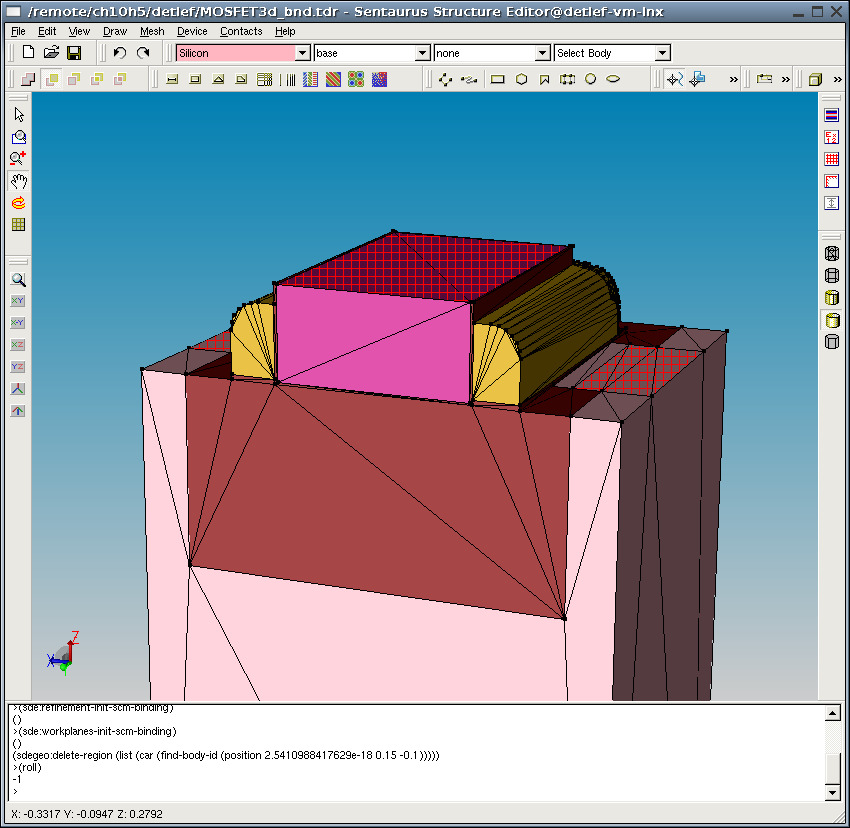
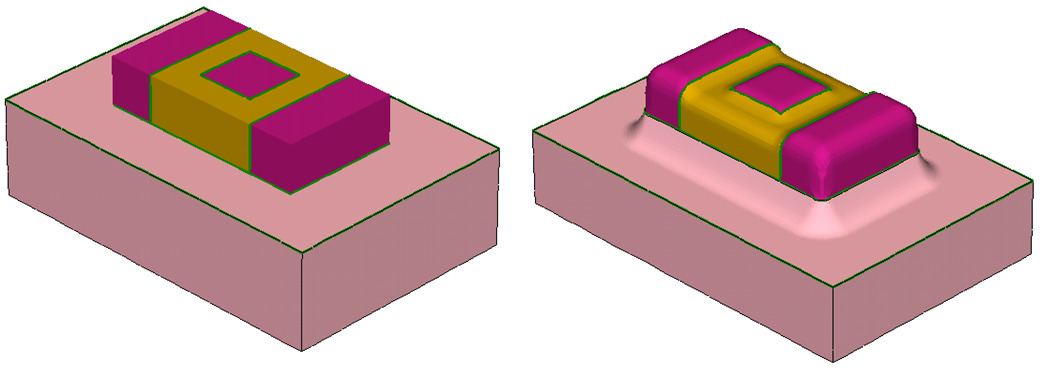
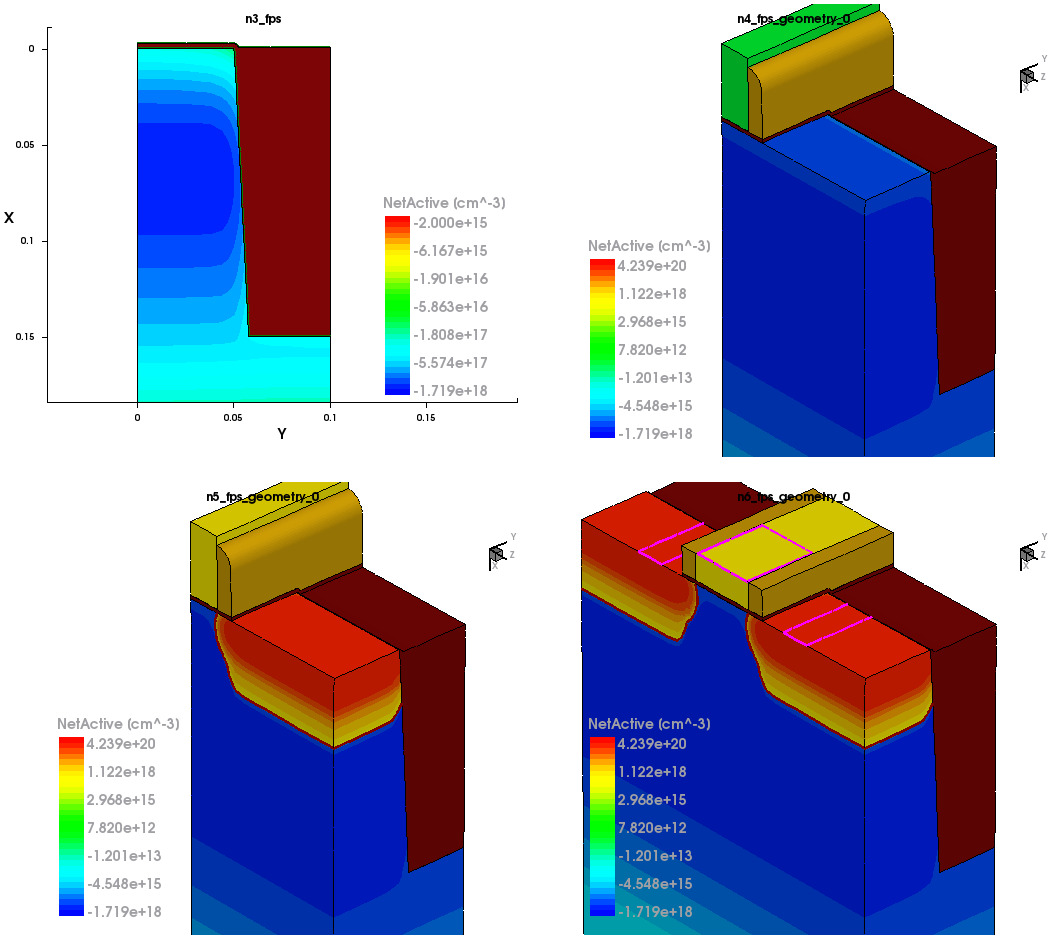
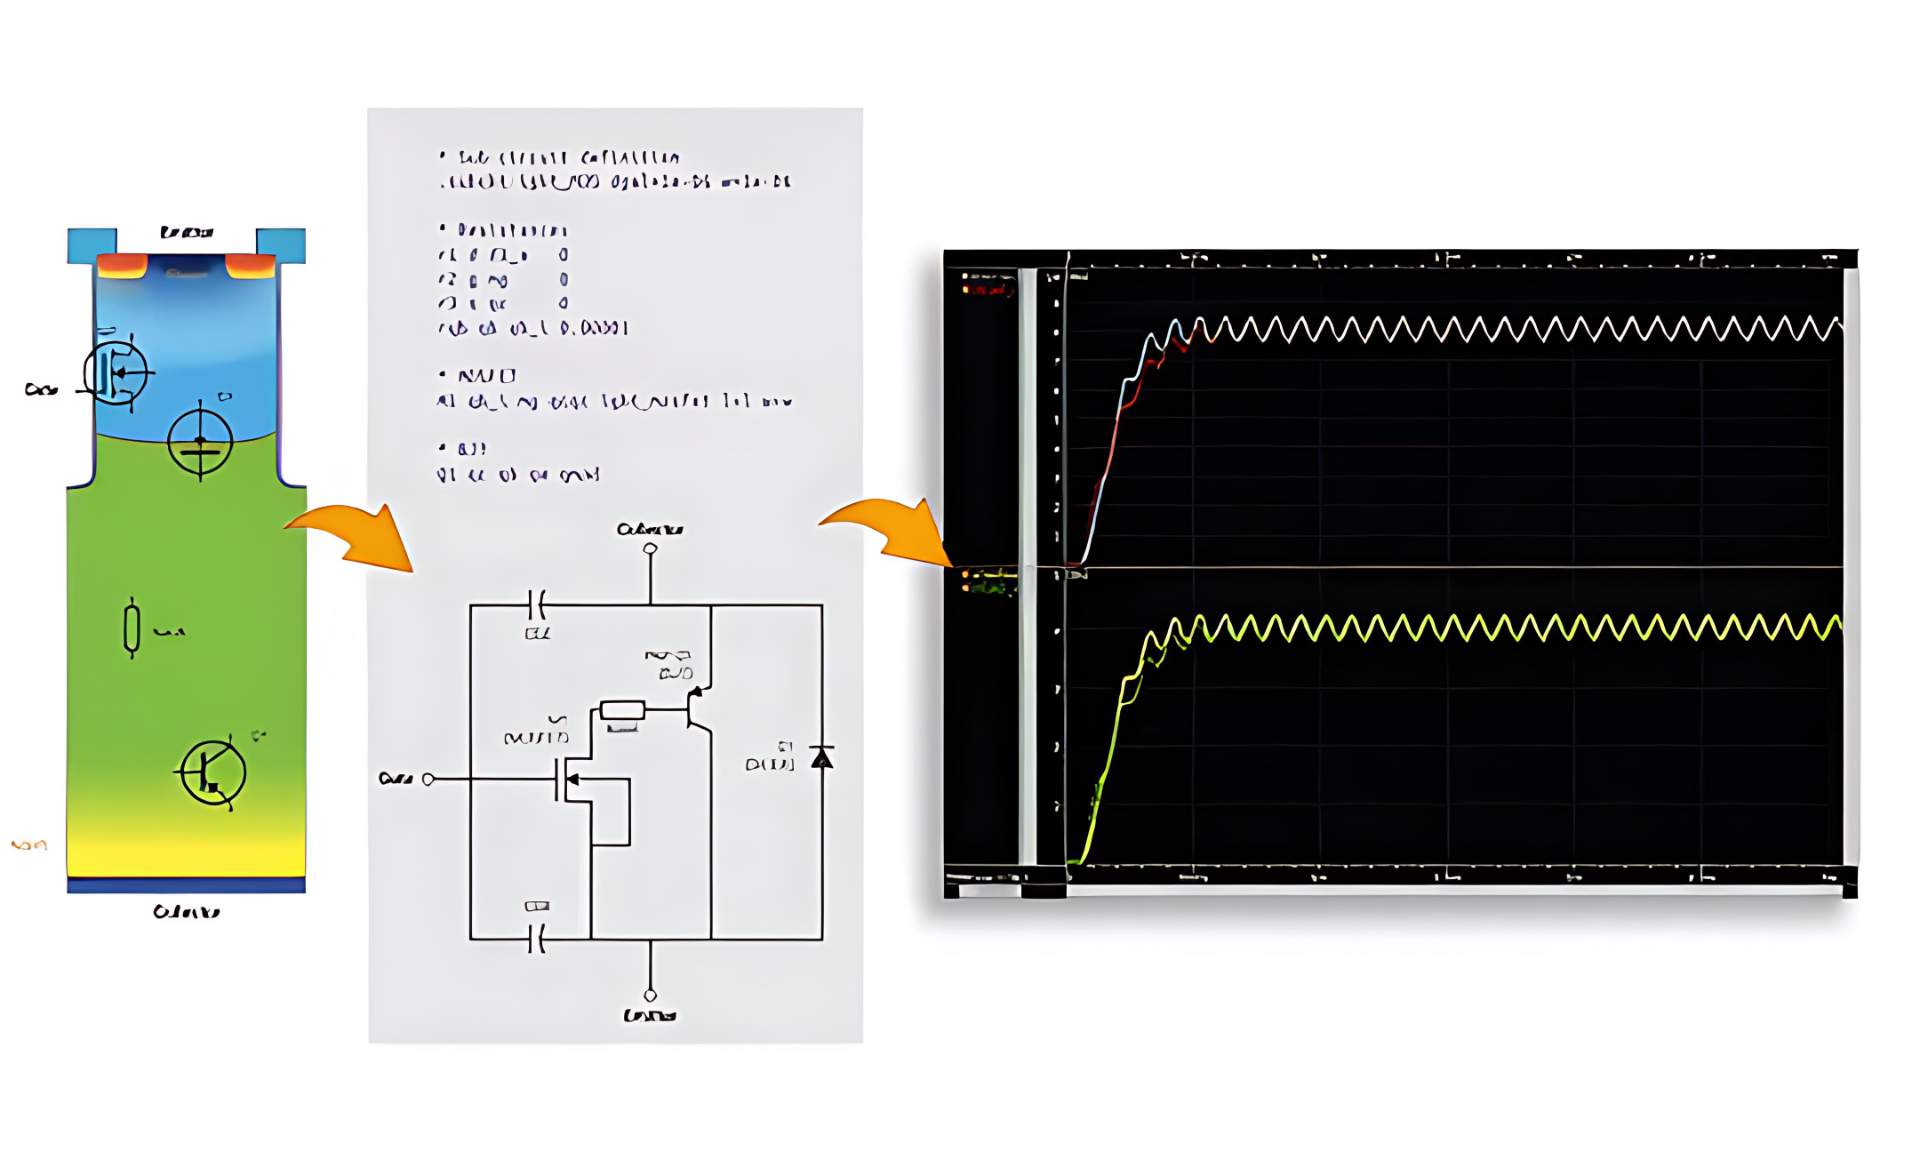
Sentaurus Visual allows you to visualize complex simulation results generated by physical simulation tools in one, two and three dimensions. You can visualize data for an initial understanding and analysis, and then modify the plots to gain a new perspective.
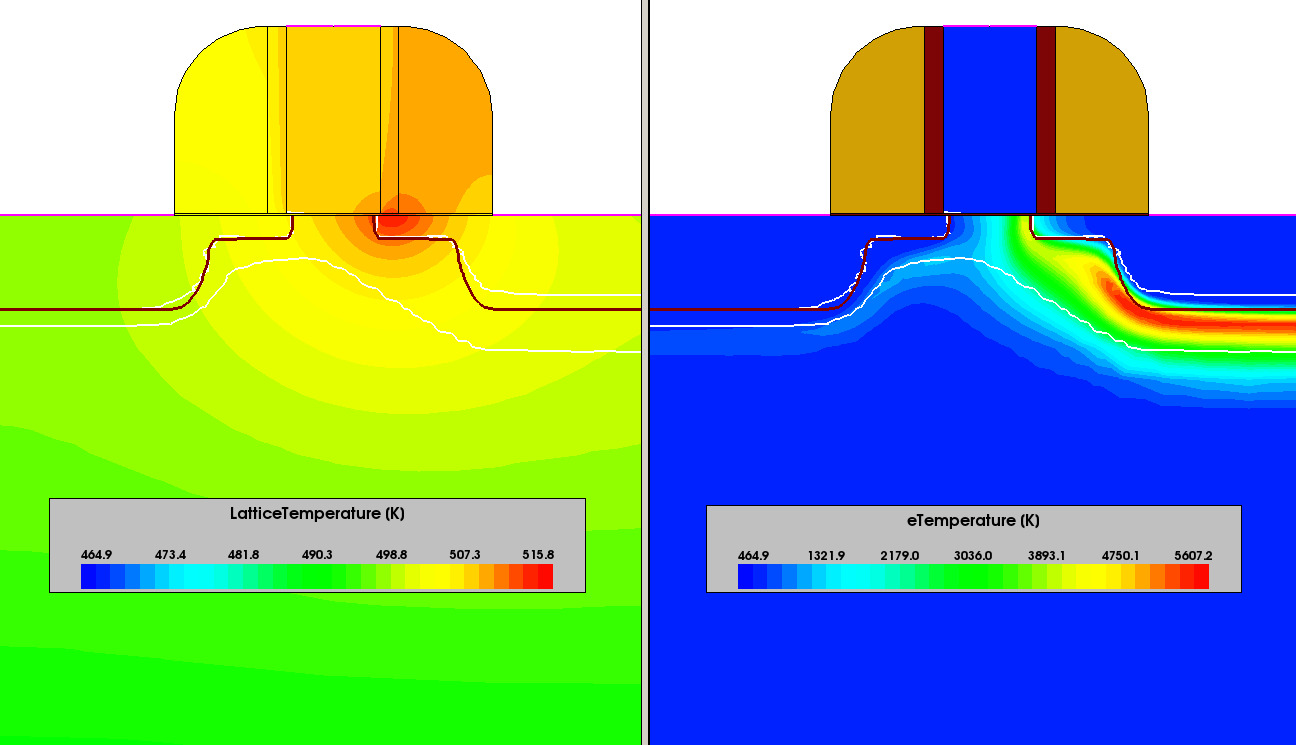
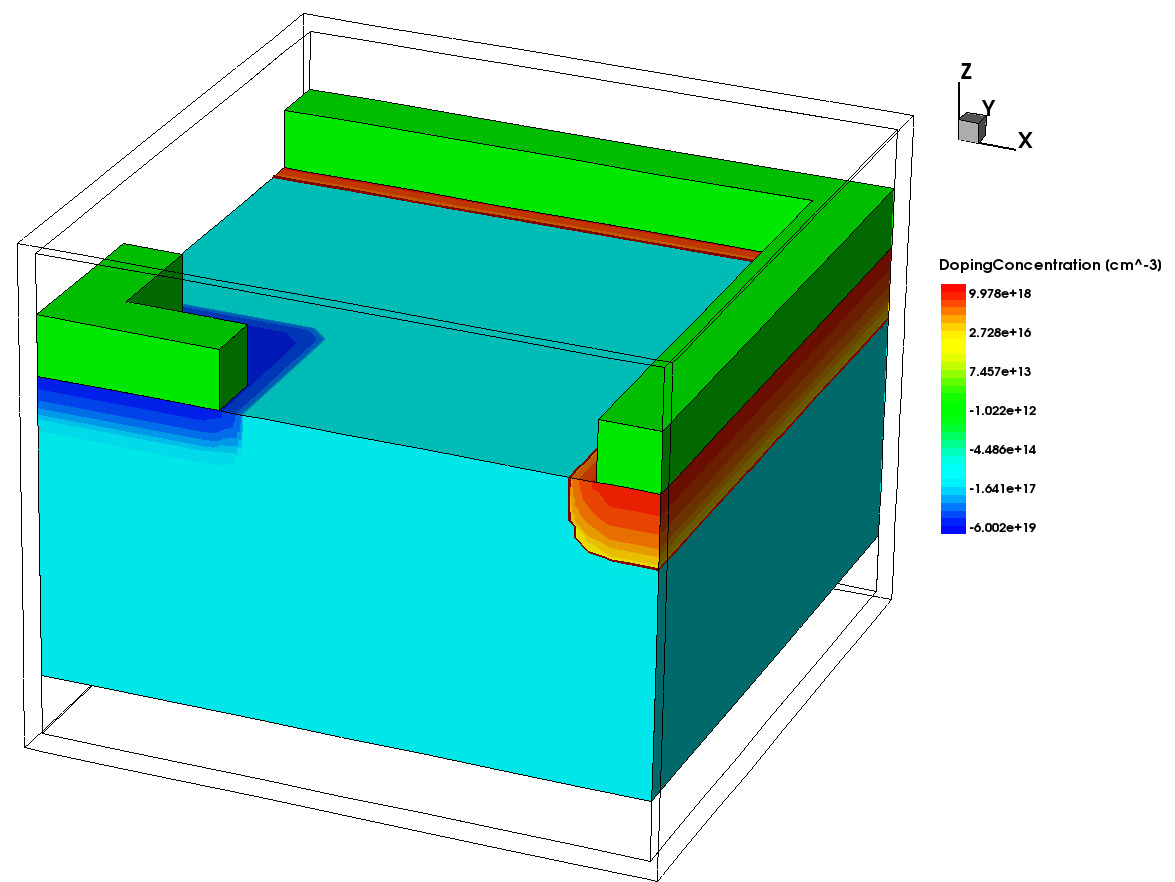
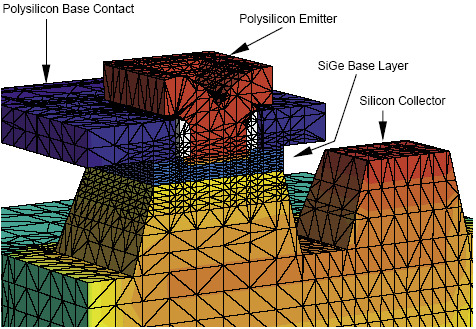
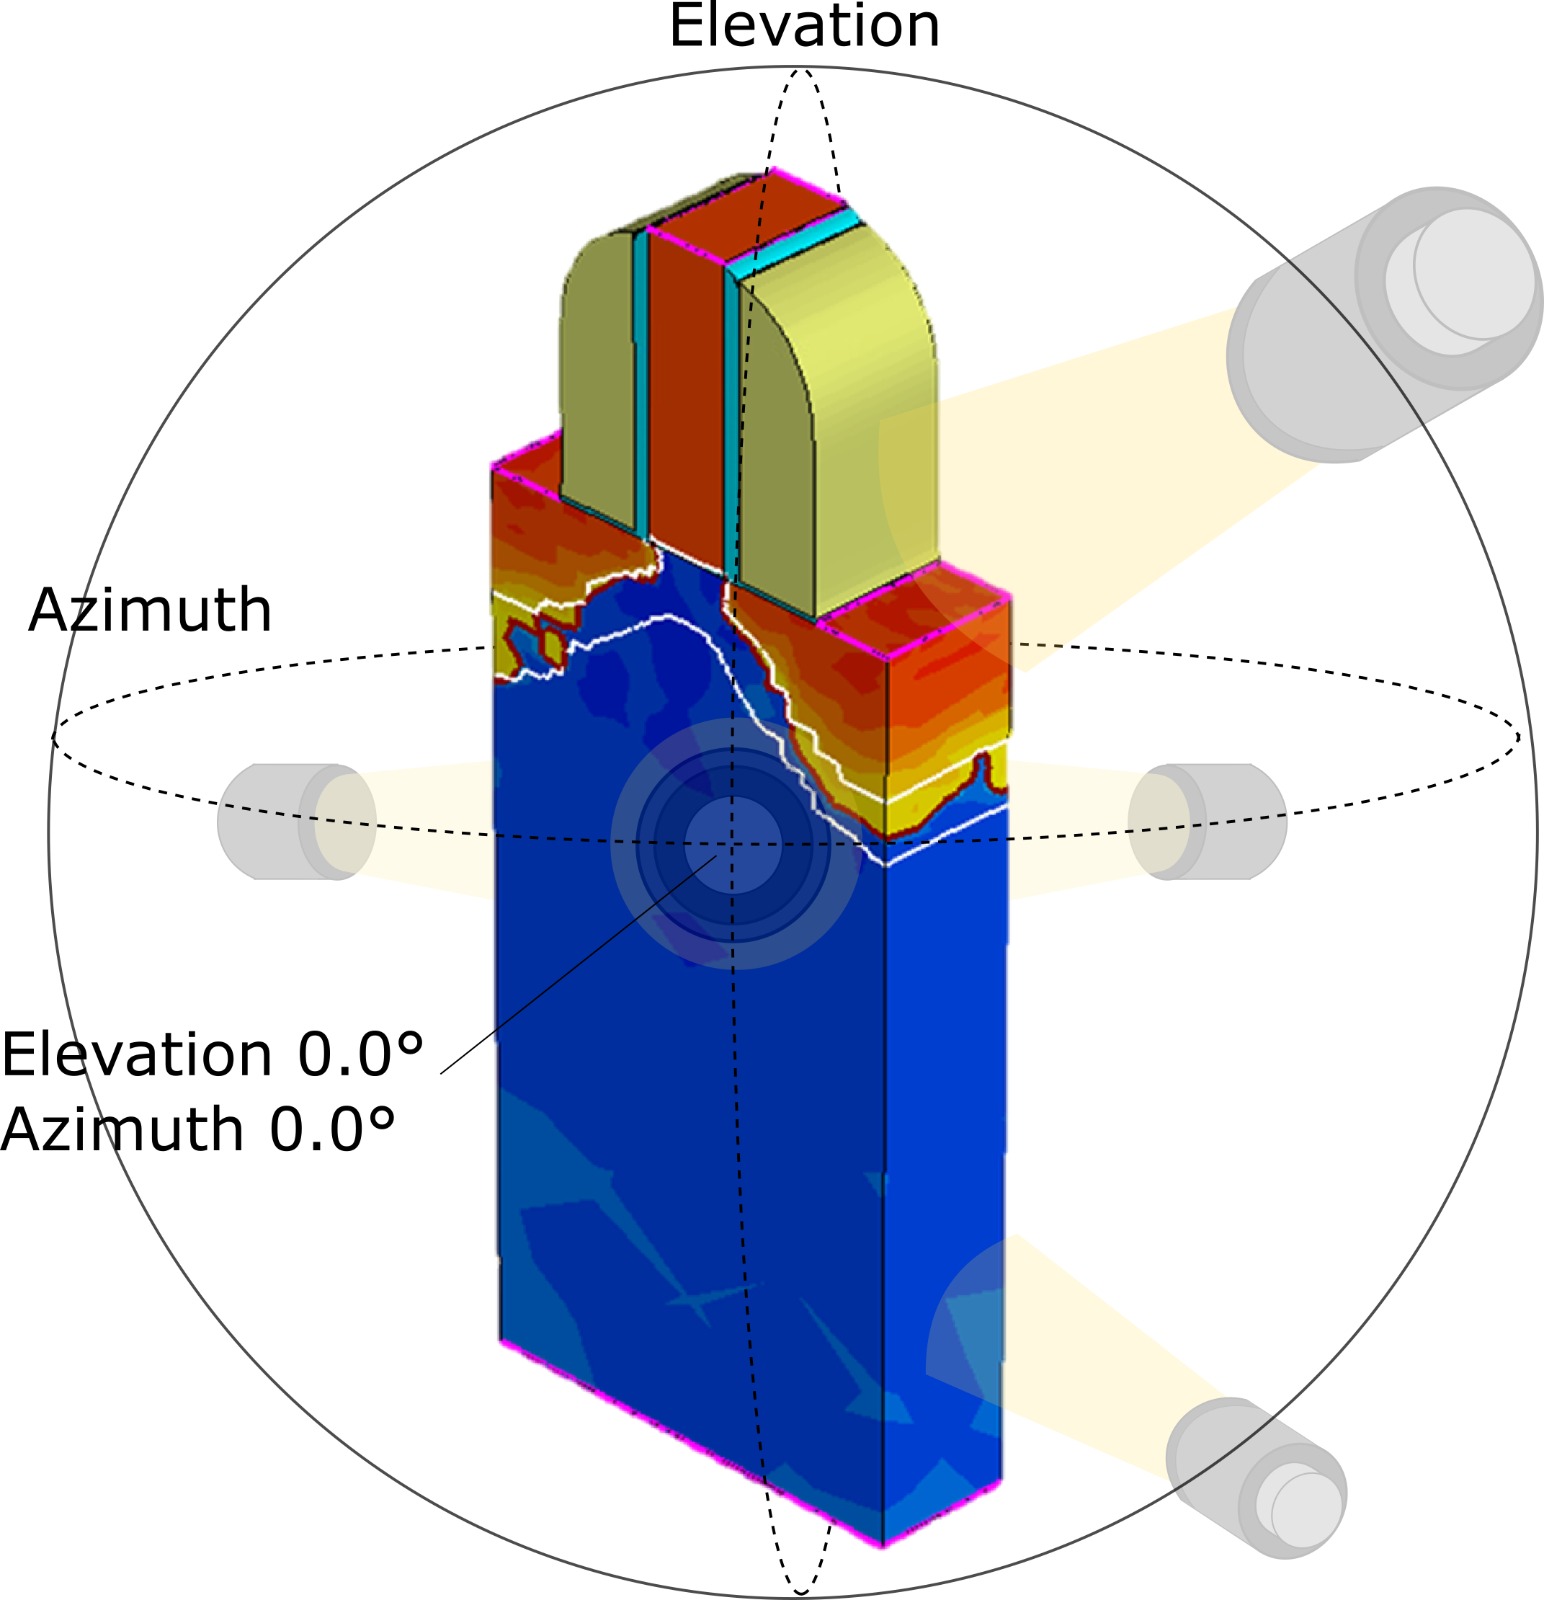
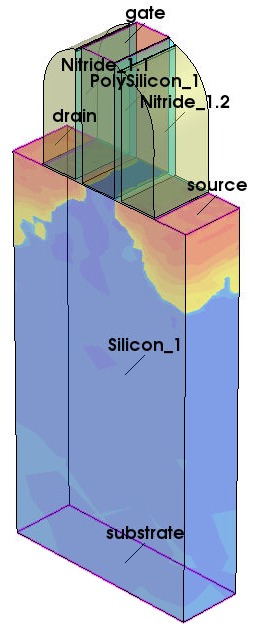
Sentaurus Visual can be used to create plots that display fields, geometries, and regions, including results such as p-n junctions and depletion layers. It also allows you to view I–V curves and doping profiles, and provides tools to zoom, pan, and rotate images. You also can extract data using measure and probe tools.
The user interface provides direct and easy-to-use functionality, as well as advanced controls for expert users. With the user interface of Sentaurus Visual, you can systematically visualize devices as xy, 2D, and 3D plots.